Welcome! This page was created in order to fulfill our CS 138 project. This is the group "Great Computer Minds" which consists of:
For the most part, we've also included sound files which correspond to each image. Just double click on the image, and if your browser has the Real Player plugin (comes with IE 4.0), then you're set to go. If not, then you might want to visit our download section to download your free Real Player.
Hope you enjoy the page!
The sound that we hear from the computer is digitized, or digital audio sound. The computer digitizes and stores analog sound, which is the actual sound waves. When the computer converts analog into digital it can be changed and also will replay the same thing every time it is played. Wave table synthesis, stores digitized sounds of instruments and plays them as opposed to FM synthesis, which makes sound waves from electrical currents
Sampling rate is the frequency at which sound samples are taken and changed into digital format. Sound samples are the digitized samples that are made when the computer converts analog sound to digitized sound. The sampling frequency must be double that of the analog frequency coming in to the computer (Foundations of Computer Music). Sampling rate is measured in kilohertz or hertz. The higher the hertz the better the sound quality produced by the computer. The amount of bits, or the sample size, also affects the quality of the sound (16 bits produces a higher quality sound than 8-bits). Signal-to-noise ratio also helps determine the quality of the audio output. It is a ratio of the volume and power of the signal to the amount of interference involved in the output of the signal (Computer Music: Synthesis, Composition, And Performance). Amplitude is a measure of how loud or soft a sound is and is measured in decibels and the Fast Fourier Transformation maps out the sound on the computer.
When we talk about sound, frequency is the measurement of sound in hertz and is what indicates the pitch of the sound. Higher frequency has a higher pitch and lower frequency has a lower pitch.
Amplitude is determined by the distance over which the vibrating surface moves. It determines the how loud or how soft a sound is and is measured in decibels.
FFT stands for "Fast Fourier Transformation." It's basically the method that the computer uses to signal which sounds contain harmonic frequencies. Today, there is computer software available that uses FFT to do analyzing, equalizing, and reducing the noise in sound recordings.
There are 2 main kinds of sound analysis:
Wave form Spectral View
the X-axis indicates time and Y-axis indicate loudness
the X-axis indicates time, but Y-axis indicate pitch.
In spectra view, higher FFT will give more exact details, but will also take a longer time for the computer to analyze.
Lower FFT Higher FFT
Here are samples of how we can use software to equalize sound:
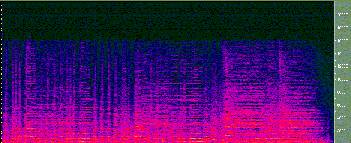 |
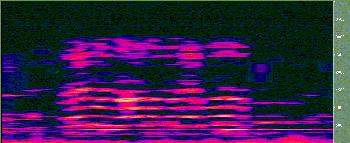
These 3 sounds are the same sound from the same classical song. The top sound is the original sound, the middle is the same sound, but with the bass cut out of it, and the bottom sound is the also the same sound, but with the treble cut out of it. |
 |
As you can see in the bottom graph, when the treble is gone from the song, the pinkish part of the graph is also gone. In the middle graph, when the bass is gone from the song, the bass line is at the bottom of the graph (the dark blue line at the bottom of the graph). |
 |
Last of all, in the top graph, when you combine the right blend of
bass and treble you get a nice blend and nice sound quality as you have
in the original.
|
Here are samples of sound that we used noise reduction feature to filter
the sound.
 |
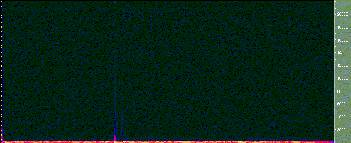
The top one is the original sound with background noises. We then used the computer to filter out and map the sound. |
 |
The middle one is the map of the same sound in which the background sound has been removed and the remaining part is the dominate sound. |
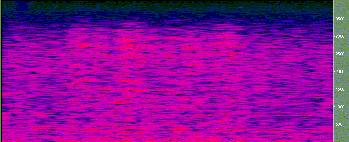 |
The one at the bottom is the sound with very much background noise. Noise reduction is very useful if you have an old record and wish to clean up those annoying background noises. |
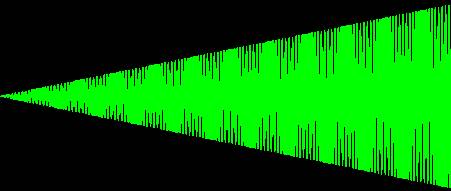
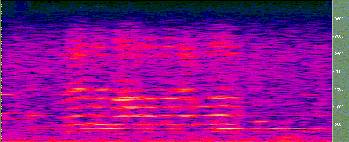
Now that you know what FFT and Spectra view are, let's see if you
can guess what kind of sound these graphs represent.
| Picture#1 | 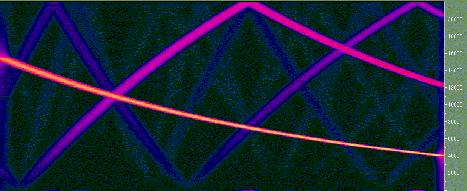 |
| Picture#2 | 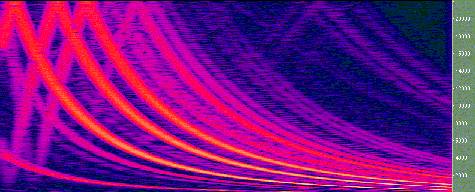 |
Here are software that we used in order to create the material in the web page.
Cooledit96 A very nice
sound editor.
Real Player A Real Audio
format player.
Denoise
A noise reducing software.
Tom Henderson (1998) The Physics Classroom [WWW document]
URL
http://www.glenbrook.k12.il.us/gbssci/phys/Class/sound/u11l2a.html
Rolf Diederichs (1996) Ultrasonic Testing Encyclopedia
[WWW document] URL
http://www.ndt.net/article/ut_az/ut_f/ut_f.htm
University of Toronto (1997) SOUND & THE AUDITORY
SYSTEM [WWW
document] URL
http://server.esc.cquest.utoronto.ca/psych/psy280f/ch9/chapter9.html
ZDNET http://www.zdnet.com.au/wsources/filters/topindx.html